Chabot College
Persistence rates of new students by gender and race-ethnicity
Fall 1995 to Spring 1996 through Fall 2000 to Spring 2001
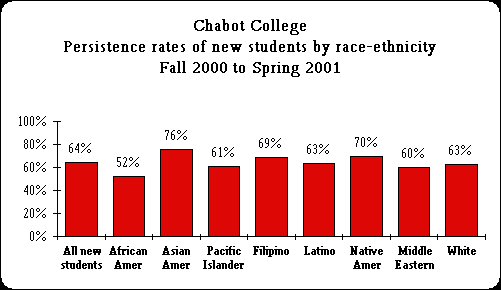
| Persistence rates measure the proportion of students in one term who continue to enroll in college from one term to the next. Term to term persistence rates are defined as the percentage of students enrolled as of Census Day in the first term who are subsequently enrolled as of Census Day in the following term. Usually, almost two thirds of new students in the Fall persist to the Spring semester. In Fall 2000, the persistence rate of new students was 64 percent. The rates of students in most race-ethnicity groups were near or above this average. However, in Fall 2000, African American, Pacific Islander, Middle Eastern, and male students had lower than average rates. |
| Persistence rates of new students | ||||||||||||
| All New Students | Gender | Race-ethnicity | ||||||||||
| Female | Male | African Amer. |
Asian Amer. |
Pacific Islander |
Filipino | Latino | Native Amer. |
Middle Eastern |
White | Other | ||
| Fall enrollments | ||||||||||||
| Fall 95 | 2,203 | 1,040 | 1,103 | 311 | 367 | 49 | 207 | 470 | 23 | 22 | 659 | 117 |
| Fall 96 | 2,110 | 1,022 | 1,021 | 347 | 323 | 60 | 186 | 419 | --- | 23 | 639 | 95 |
| Fall 97 | 2,160 | 1,120 | 982 | 354 | 308 | 55 | 165 | 450 | 21 | 21 | 677 | 130 |
| Fall 98 | 1,933 | 954 | 927 | 314 | 309 | 65 | 141 | 424 | 28 | 26 | 521 | 105 |
| Fall 99 | 2,256 | 1,127 | 1,073 | 398 | 345 | 65 | 151 | 524 | 24 | 35 | 598 | 37 |
| Fall 00 | 2,086 | 1,031 | 1,010 | 303 | 351 | 64 | 182 | 513 | 20 | 25 | 500 | 29 |
| Fall to Spring persistence rates | ||||||||||||
| F95/S96 | 68% | 70% | 66% | 55% | 79% | 73% | 75% | 68% | 48% | 82% | 64% | 50% |
| F96/S97 | 66% | 69% | 64% | 53% | 75% | 65% | 76% | 63% | --- | 74% | 68% | 66% |
| F97/S98 | 63% | 66% | 60% | 58% | 75% | 64% | 67% | 63% | 62% | 57% | 58% | 53% |
| F98/S99 | 64% | 66% | 61% | 52% | 73% | 58% | 65% | 60% | 61% | 77% | 67% | 67% |
| F99/S00 | 63% | 63% | 63% | 52% | 75% | 57% | 72% | 57% | 50% | 77% | 68% | 57% |
| F00/S01 | 64% | 68% | 62% | 52% | 76% | 61% | 69% | 63% | 70% | 60% | 63% | 66% |
| NOTE: --- Less than 20 students | ||||||||||||

Last Updated on 6/3/02
By research