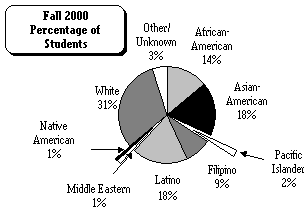
| A Profile of Asian, Pacific Islander, and Filipino Students at Chabot College | |||||||||
 |
Asian Students | Filipino Students | |||||||
| Year | Number | Percent | Number | Percent | |||||
| 1978 | 719 | 5% | 426 | 3% | |||||
| 1980 | 936 | 6% | 579 | 4% | |||||
| 1982 | 1,324 | 8% | 738 | 4% | |||||
| 1984 | 1,261 | 9% | 777 | 6% | |||||
| 1986 | 1,568 | 10% | 908 | 7% | |||||
| 1988 | 1,783 | 12% | 1,096 | 8% | |||||
| 1990 | 2,076 | 13% | 1,266 | 9% | |||||
| 1992 | 2,411 | 16% | 1,386 | 9% | |||||
| 1994 | 2,185 | 17% | 1,223 | 9% | |||||
| 1996 | 2,334 | 18% | 1,203 | 9% | |||||
| 1998 | 2,385 | 18% | 1,208 | 9% | |||||
| 2000 | 2,611 | 18% | 1,281 | 9% | |||||
| Chabot College Fall 2000 | |||||||||
| All Asian students: | 2,611 | Asian | Pac.Isl | Filipino | All | ||||
| Chinese | 41% | students | students | students | Chabot | ||||
| Vietnamese | 17% | Gender | 2,611 | 309 | 1,281 | 14,252 | |||
| Asian Indian | 15% | Male | 49% | 47% | 43% | 44% | |||
| Korean | 5% | Female | 51% | 53% | 57% | 56% | |||
| Japanese | 4% | 100% | 100% | 100% | 100% | ||||
| Other Asian | 17% | Student Type | |||||||
| 100% | New (first time college) | 13% | 21% | 14% | 15% | ||||
| All Pacific Islander students: | 309 | New transfer | 17% | 14% | 15% | 13% | |||
| Guamanian | 12% | Returning transfer | 5% | 4% | 5% | 4% | |||
| Hawaiian | 14% | Returning | 9% | 7% | 12% | 11% | |||
| Samoan | 8% | Continuing | 53% | 53% | 52% | 55% | |||
| Other | 67% | In high school | 3% | 1% | 2% | 2% | |||
| 100% | 100% | 100% | 100% | 100% | |||||
| All Filipino students: | 1,281 | Educational Goal | |||||||
| Transfer | 36% | 39% | 39% | 41% | |||||
| Citizenship | Asian | Pac.Isl. | Filipino | AA/AS only | 6% | 15% | 10% | 10% | |
| U.S. Citizen | 47% | 60% | 69% | Certificate | 16% | 12% | 13% | 15% | |
| Permanent resident | 42% | 31% | 29% | Personal Development | 9% | 4% | 4% | 8% | |
| Student visas and other | 11% | 10% | 2% | Other/Undecided | 33% | 31% | 34% | 26% | |
| Top local high school districts of all Asian, Pacific Islander, & Filipino students (by number of students) | 100% | 100% | 100% | 100% | |||||
| Age | |||||||||
| Asian | Pac.Isl. | Filipino | 19 or younger | 23% | 34% | 25% | 23% | ||
| New Haven Unified | 243 | 31 | 227 | 20-21 | 16% | 21% | 19% | 15% | |
| Hayward Unified | 204 | 73 | 163 | 22-24 | 12% | 18% | 17% | 13% | |
| Fremont Unified | 131 | 9 | 52 | 25-29 | 14% | 13% | 13% | 13% | |
| San Lorenzo Unified | 110 | 10 | 66 | 30-39 | 19% | 8% | 13% | 18% | |
| San Leandro Unified | 102 | 16 | 56 | 40-49 | 10% | 6% | 8% | 11% | |
| Castro Valley Unified | 67 | 7 | 17 | 50 or older | 6% | 0% | 5% | 8% | |
| Moreau | 13 | 7 | 56 | 100% | 100% | 100% | 100% | ||
| Persistence Rates* of new students | |||||||||
| New Students | F94-S95 | F95-S96 | F96-S97 | F97-S98 | F98-S99 | F99-S00 | F00-S01 | ||
| All new students | 68% | 68% | 66% | 63% | 64% | 63% | 64% | ||
| New Asian/Pac.Isl. students | 83% | 79% | 74% | 74% | 71% | 72% | 74% | ||
| New Filipino students | 70% | 75% | 76% | 67% | 65% | 72% | 69% | ||
| SOURCES: Institutional Research Dataset: Fall 2000, Fall/Spring 1994-2000 final files;Spring 01 Census files | |||||||||
| NOTES: * Persistence rate: Percentage of students enrolled in Fall who also enrolled the following Spring | |||||||||
Last Updated on 9/11/01
By research