Chabot
College
Basic Skills Persistence Study
New Students who succeeded in Elementary Algebra in Fall 1996
Persistence in Math within two years
by Gender and Race-ethnicity
Math 65/65A (Elementary
Algebra) into Math 55/55A (Intermediate Algebra)
New students successfully completing Math 65/65A in Fall 1996
enrolling or succeeding in Math 55/55A within 2 years (by Summer 1998)
| Total | Gender | Race-ethnicity | ||||||||||||||
| Fall 1996 Math 65/65A | Students | Female | Male | African American |
Asian | Filipino | Latino | White | ||||||||
| Success | 100 |
47%
|
45 |
48%
|
51 |
45%
|
4 |
19%
|
14 |
42%
|
16 |
48%
|
23 |
46%
|
33 |
56%
|
| Non-Success | 37 |
17%
|
14 |
15%
|
23 |
20%
|
6 |
29%
|
8 |
24%
|
5 |
15%
|
8 |
16%
|
8 |
14%
|
| Withdraw | 78 |
36%
|
34 |
37%
|
40 |
35%
|
11 |
52%
|
11 |
33%
|
12 |
36%
|
19 |
38%
|
18 |
31%
|
| Total | 215 |
100%
|
93 |
100%
|
114 |
100%
|
21 |
100%
|
33 |
100%
|
33 |
100%
|
50 |
100%
|
59 |
100%
|
| Percentage of successful Math 65/65A students enrolling or succeeding in Math 55/55A | ||||||||||||||||
| Enrolled in Math 55/55A |
89%
|
82%
|
98%
|
|
86%
|
81%
|
96%
|
97%
|
||||||||
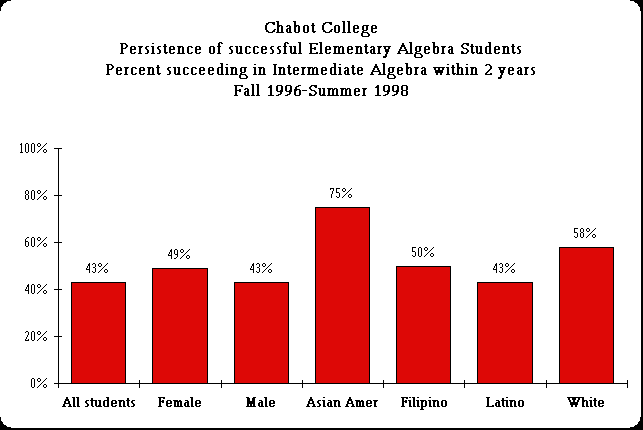
| Succeeded in Math 55/55A |
43%
|
49%
|
43%
|
|
75%
|
50%
|
43%
|
58%
|
||||||||
| NOTE: — Percent not calculated for fewer than 10 students | ||||||||||||||||
| SOURCE: Institutional Research Dataset | ||||||||||||||||
![]()